Monitoring Your Work
ACTIVATE features several data monitoring modules as well as a monitor dashboard to track your work.
Home
The Home page displays important data at a glance.
Workflow Runs
This module shows a snapshot of your most recently run workflows.

Data columns for your workflow runs include:
- Workflow
- Run
- Status
- Submitted
- Runtime
If you click a run’s number in the Run column, you’ll be taken to that run’s detail page. Clicking the workflow’s name takes you to its configuration form.
A workflow’s Status can be Started, Running, Completed, Canceled, or Error. The status buttons above the table filter the list.
The Workflow Runs module also includes two action buttons:
- Cancel Run
- Run Workflow Again
If you click the icon to re-run a workflow, you’ll be taken to the workflow’s configuration form on the Workflows page.
Storage Resources
There is a module for each storage category — Buckets, NFS, Disks, and Lustre. Each one shows your favorited resources of that type and their status.

If you click the information icon, you’ll be taken to the storage’s configuration form on the Storage page.
Compute Clusters
This module shows your favorited resources and their status (active nodes and requested nodes if active or stopped if inactive).

The navy bar reflects the number of maximum nodes a resource can have. In the screenshot above, the resource has the controller node and a partition that’s configured for 10 maximum nodes, for a total of 11 possible nodes.
The green bar reflects the number of active nodes on a compute resource. In the screenshot above, the resource is active but not running any jobs, so there is 1 active node (the controller).
If you click the gear icon, you’ll be taken to the resource’s Definition tab on the Clusters page.
If you click the information icon, you’ll be taken to the resource’s Sessions tab on the Clusters page.
Workflows
On the Workflows page, click a workflow. You’ll be taken to the workflow’s Runs tab.

The Runs tab lists every run of this workflow, with its status, when it finished, and how long it took. It also includes action buttons to re-run, cancel, and delete a run.
Click a run to open its detail page, where the dependency graph shows each job and step. Click General log, or a step in the graph, to open its log.
You can save a log by clicking the Download button.
Clusters
When monitoring a cluster, the most important features are its Status and Jobs tab.
Storage
When you click on a persistent storage resource, you’ll be taken to the storage’s Details tab. Click Events to see everything that has happened to that resource.

The Events tab shows one row per action on this storage resource, including:
- Time
- Type
- Actor
- Target
- Outcome
Use the Time range and Outcome filters to narrow the list.
Ephemeral Storage
Please note that ephemeral storage resources don’t have this page because they’re created and destroyed with a resource.
Monitor
In the sidebar category Monitor, the Cost and Instances pages track spend and running instances. Jobs and Queues cover scheduler activity.
Cost
The Cost page shows your cost data across ACTIVATE. For more information about this page, please see Monitoring Costs.
Instances
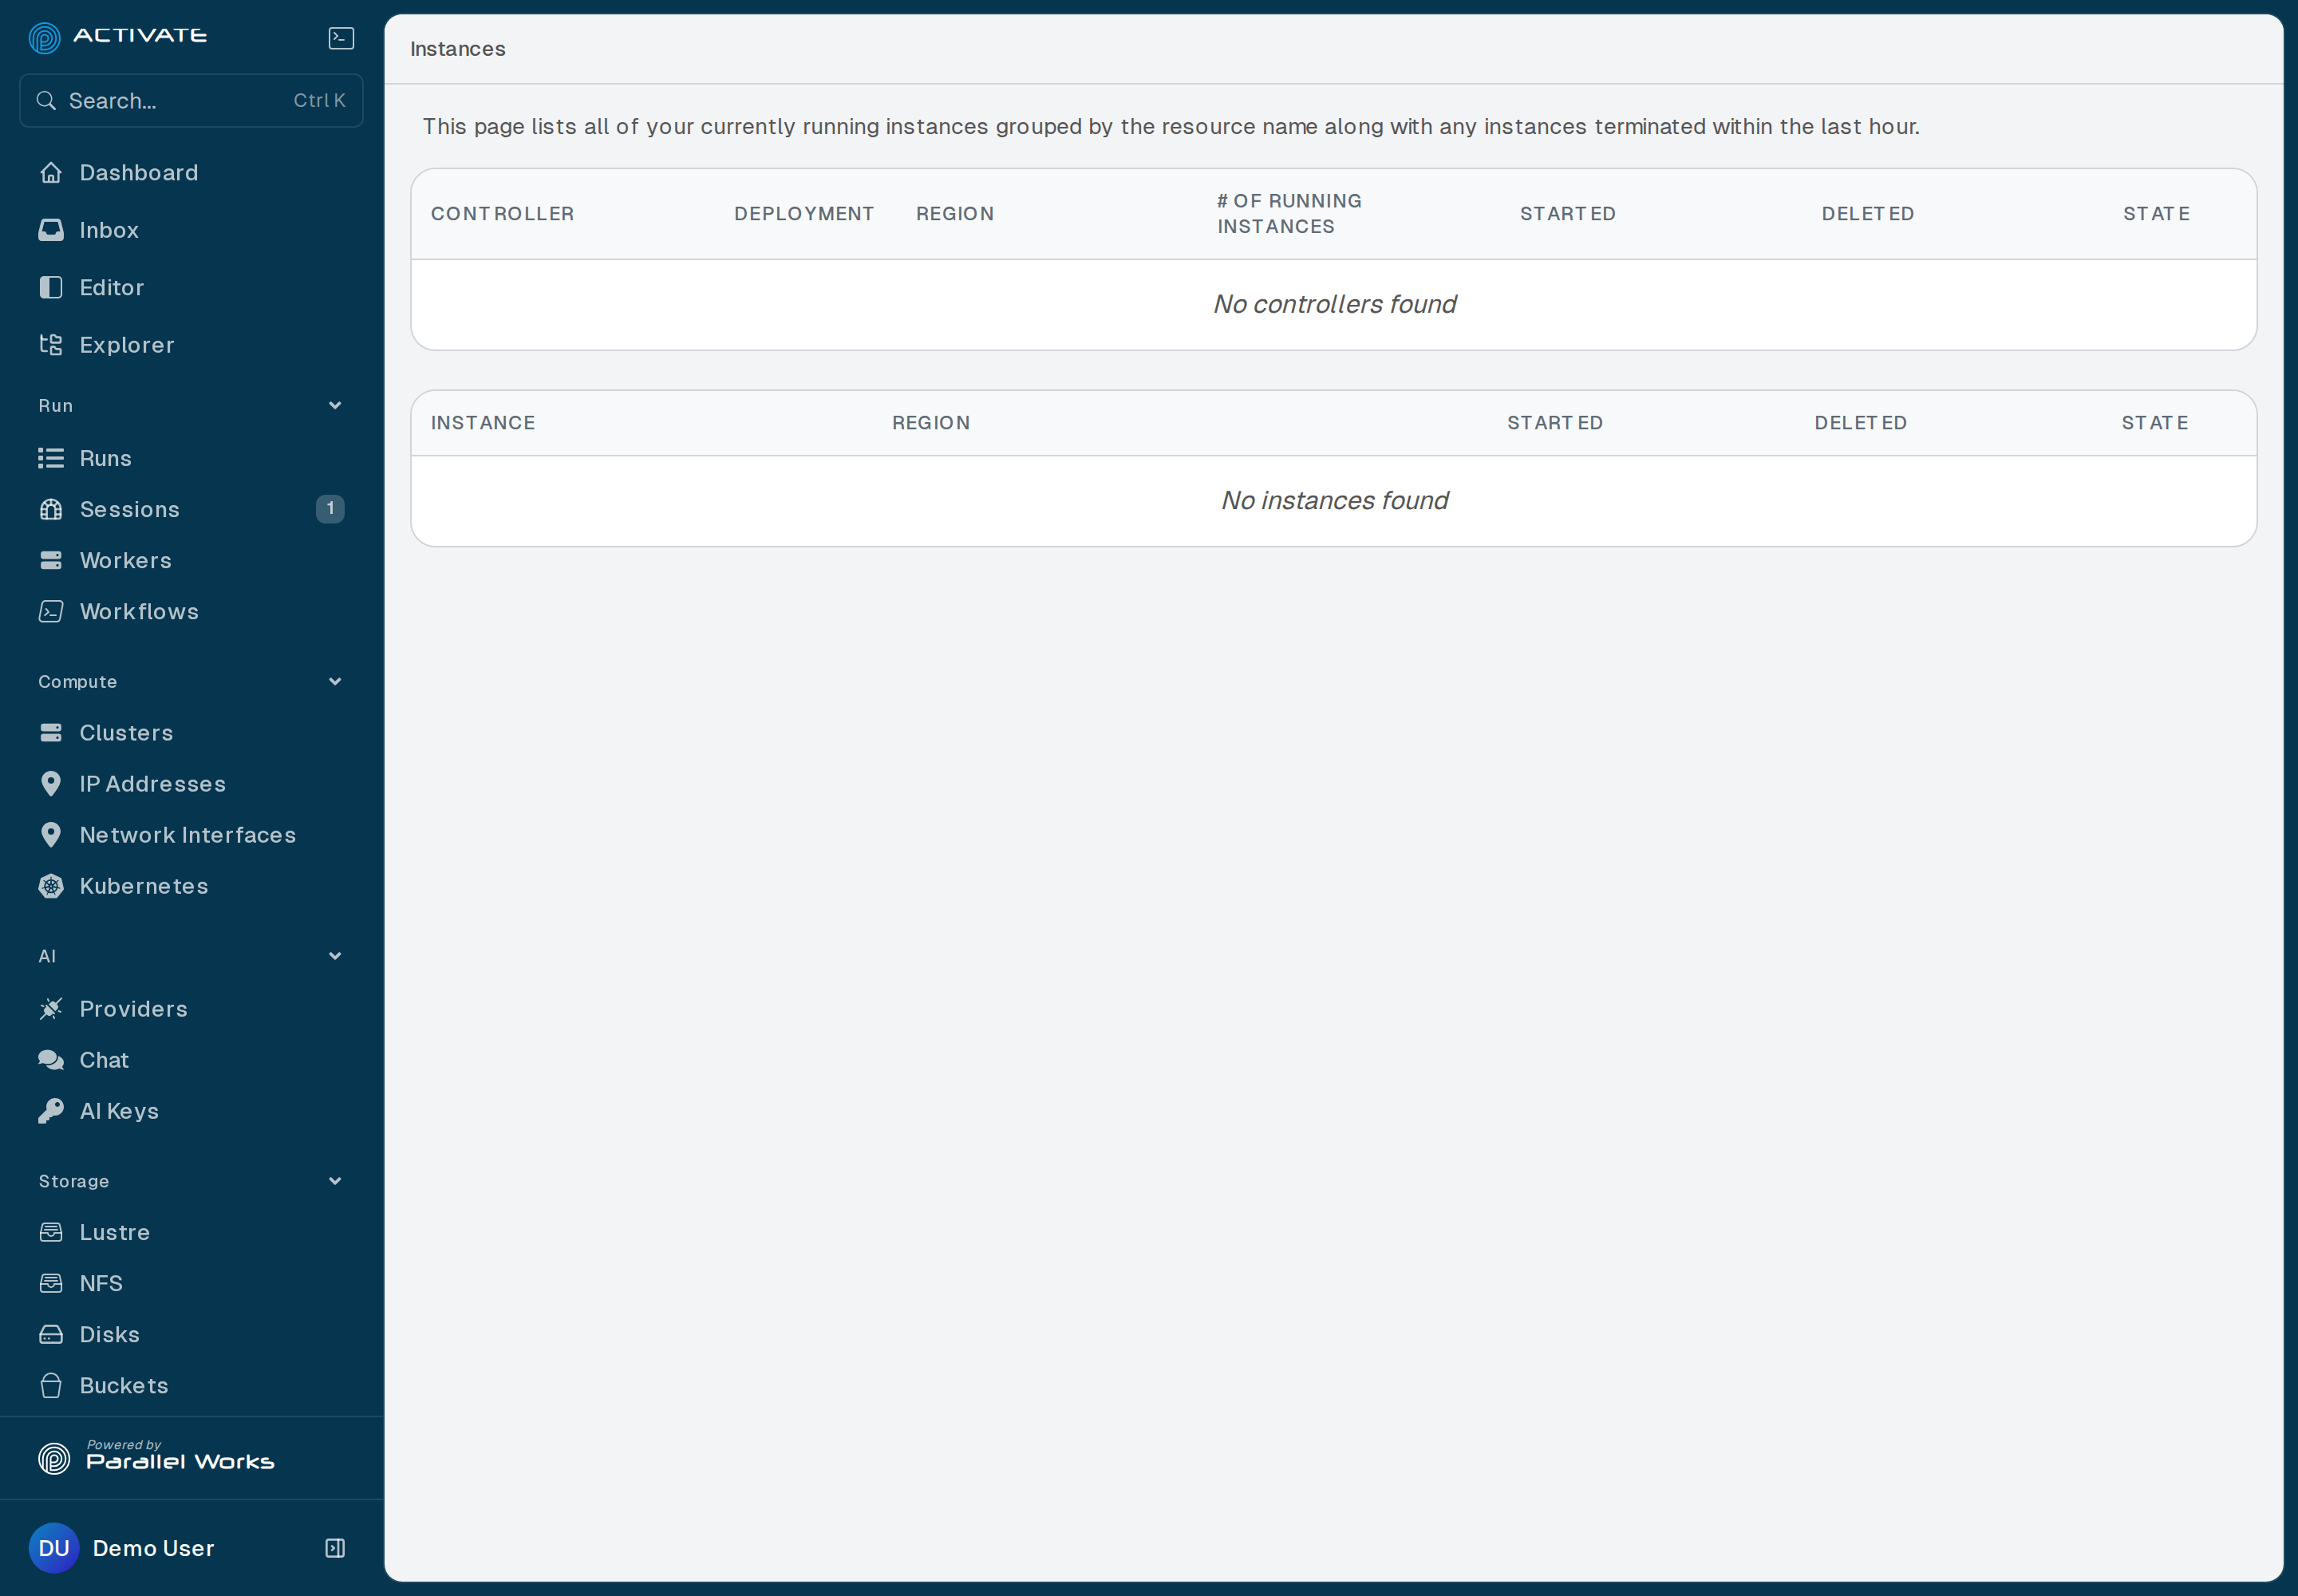
The Instances page shows your active and deleted clusters within the last hour.
The first table groups instances by the cluster that owns them and includes the following data:
The second table lists standalone instances.
If a cluster is active, its State will show Running in green.
If a cluster has recently been shut down, its State will show Deleted in blue.

If you haven’t started or stopped a cluster within the last hour, the page will show the messages No controllers found and No instances found.