The Scalable
Hybrid Cloud Platform
Seamless HPC & AI compute management that unifies user experience, financial transparency, and workload mobility across any infrastructure.
Organizations
Compute Hours
Faster Time-to-Science
One console. Every cluster.
What your scientists and operators see the moment ACTIVATE is wired into your fleet.
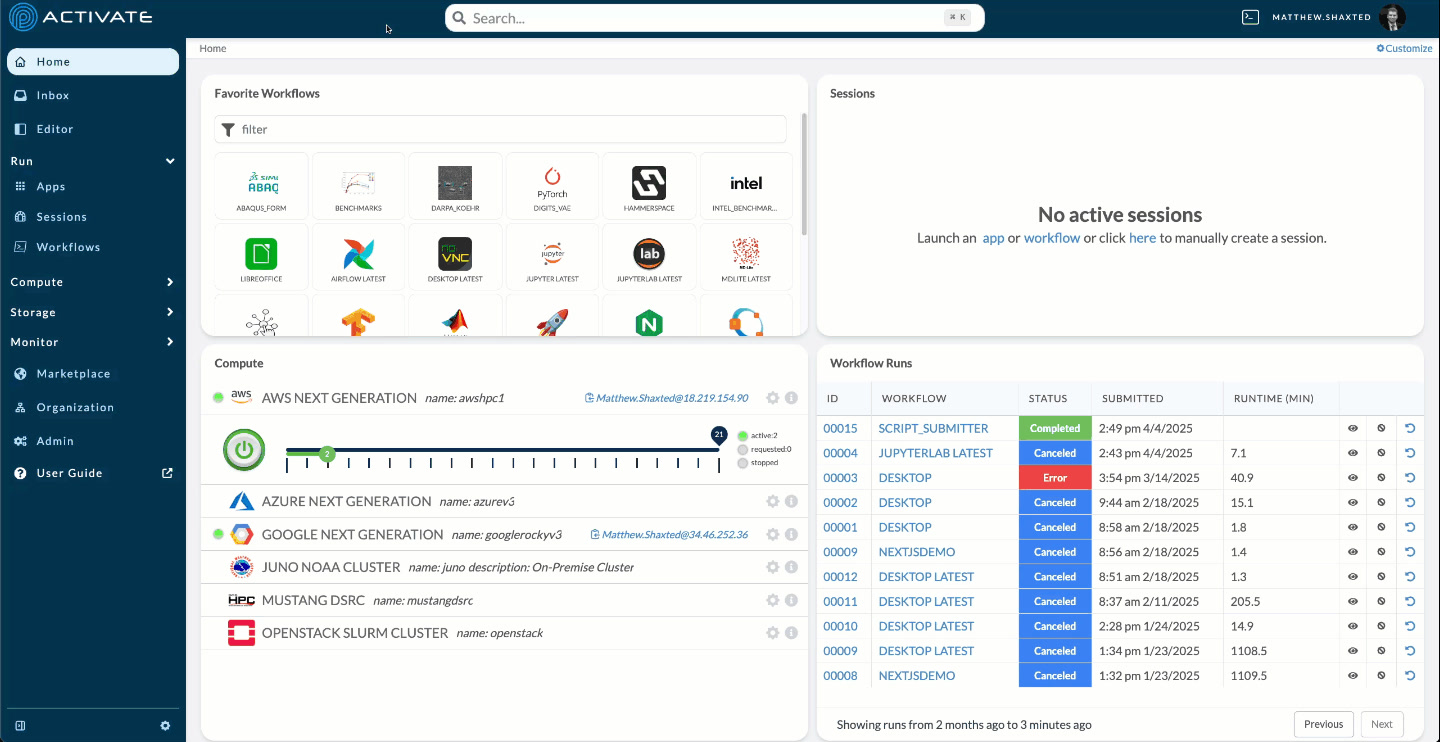
A Central Nervous System for Distributed Computing
ACTIVATE provides a unified control plane that simplifies access to compute resources across any infrastructure—from on-premises clusters to multiple cloud providers.
Solving Key Challenges
ACTIVATE addresses the most pressing challenges facing organizations with distributed computational workloads.
From On-Premises to Any Cloud
ACTIVATE supports the full spectrum of deployment options, from completely on-premises to fully cloud-native, with any hybrid configuration in between.
- On-premises HPC clusters
- AWS, Azure, GCP, and OCI
- Hybrid multi-cloud configurations
- Government and air-gapped environments
On-Premises
Full integration with your existing HPC clusters
Hybrid
Seamless workload mobility across environments
Cloud Native
Scale elastically with any cloud provider
Hyperscale Clouds
GPU Neoclouds
What Our Customers & Partners Say
“Parallel Works ACTIVATE lets us focus on research, not the digital plumbing that supports it. We are using it to run a digital twin model of the Earth's thermosphere and ionosphere, which lets us research and predict space weather more effectively.”
“Parallel Works ACTIVATE makes it easier for researchers to access their computing resources. ACTIVATE dramatically improves 'time to science' for bio-medically focused researchers in their efforts ranging from genomics and pathology to drug development.”
Shailesh Shenoy
Senior Staff Scientist and Assistant Dean for Einstein Information Technology
Albert Einstein College of Medicine“The ability to combine the DoD's high-performance compute and share loads with cloud-based high-performance compute is something that only the commercial sector can provide today. We're delighted that DIU was able to help HPCMP add two new-to-DoD vendors with this capability.”
Trusted by organizations across industries
Works with leading cloud providers
Recent Coverage
BizTechReports - Life Sciences Sector Reframes High Performance Compute Strategy as AI Drives Demand for Flexible Infrastructure
HPCwire - From GPU Capacity to Productivity: Closing the Operationalization Gap
DataCenterDynamics - Hybrid Multi-Cloud is Becoming the Default Architecture for AI and HPC
Enterprise-Grade Security
ACTIVATE is built from the ground up with security and compliance at its core, meeting the most stringent government and enterprise requirements.
IL5 ATO
Authorization to Operate for our High Security Platform (HSP) at hpcmp.hsp.mil
Government Ready
Secure infrastructure for sensitive government workloads
Role-Based Access Control
Granular permissions with SSO, OIDC, LDAP, and SAML integration
Zero Trust Architecture
End-to-end encryption with identity-based access controls
Featured in leading technology publications
Ready to Accelerate Your Computing?
Join leading research institutions, government agencies, and enterprises using ACTIVATE to transform their computational workflows.